April Rent Report: Trenton, NJ, Tops the Most Unaffordable List

Many or all of the products featured here are from our partners who compensate us. This influences which products we write about and where and how the product appears on a page. However, this does not influence our evaluations. Our opinions are our own. Here is a list of our partners and here's how we make money.
The most recent rent report is available here: June rent report: Rent growth is cooling, but prices remain high
Most U.S. cities are unaffordable based on the most recent data available on market rents and median income, with Trenton, New Jersey, replacing Bridgeport, Connecticut, at the top of the “unaffordable” list since the previous month's report.
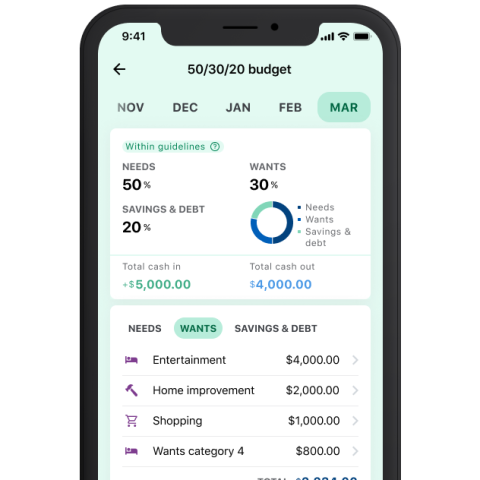
The meaning of unaffordable may vary by household, but the general guideline is you should spend no more than 30% of your gross income on rent. Among the most unaffordable cities, median income earners in six places would be considered “severely rent burdened” by federal standards.
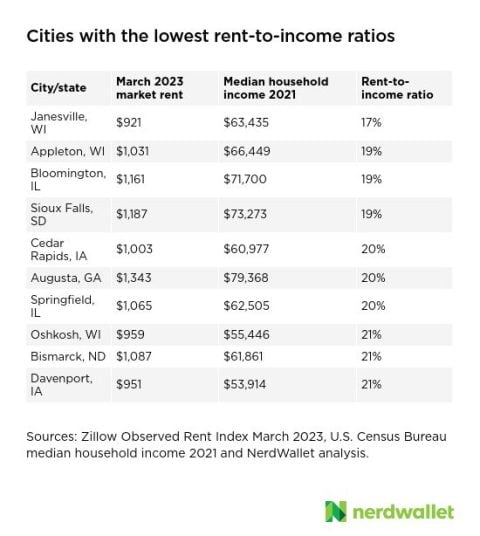
Meanwhile, Janesville, Wisconsin, became the most affordable city for renters among the cities surveyed, after ranking as third most affordable in the previous month's analysis.
A monthly NerdWallet rent-to-income ratio analysis of 225 cities in the U.S. finds that, based on the most recent data, 65% of rents on the market were equal to or above the recommended 30% ratio in March. In February, the ratio was also 65%.
That means market rents are moderately to severely burdensome for residents in 65% of U.S. cities measured. Market rent comes from data on the real estate website Zillow, based on March data, and median income used for this analysis is from 2021 U.S. Census Bureau data. The data doesn’t differentiate between incomes for residents who own rather than rent in those cities.

By federal standards, spending 30% to 49% of income on rent means a household is “moderately rent burdened,” and spending 50% or more means a household is “severely rent burdened,” according to the NYU Furman Center, which conducts research about housing and urban policy.
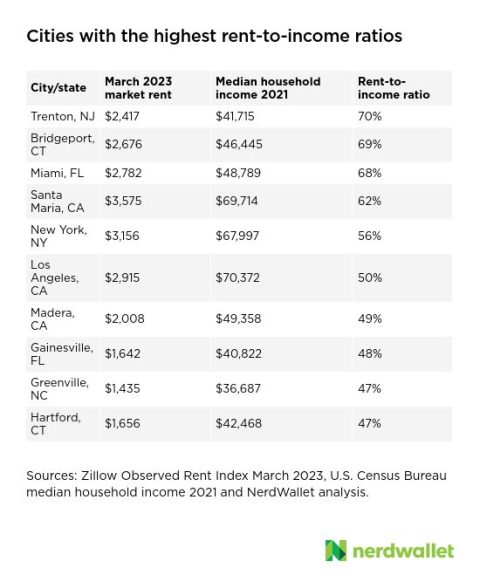
Among the 225 cities analyzed, six have rent-to-income ratios that put renters with median incomes in the “severely rent burdened” category for March 2023:
Trenton, New Jersey: 70%.
Bridgeport, Connecticut: 69%.
Miami: 68%.
Santa Maria, California: 62%.
New York City: 56%.
Los Angeles: 50%.
Renters with the greatest financial burden for housing tend to be seniors, low-income households, immigrants and racial or ethnic minorities, according to a 2015 Zillow analysis of U.S. Census Bureau data.
Here are the cities with the least and most affordable rental housing markets, according to March 2023 rental market data by Zillow.
Find out how affordable your city is and learn about more rental market trends.
Are rents increasing or decreasing?
From February to March, the price of advertised rents increased by 0.5%, according to Zillow’s rental report for March 2023. That monthly increase is slightly smaller than the average March increase of 0.6% observed from 2016 to 2019, according to the Zillow report. In February, monthly rent increased 0.3%. Typical asking rents in March increased by 6% to $1,996 compared with the same time last year; it’s just behind the peak national typical asking rent of $1,997 in September 2022.
Among the 49 cities Zillow tracks in its monthly Observed Rent Index, only two saw rent decreases from February to March: Detroit (-0.13%) and Portland, Oregon (-0.03%). The cities with the lowest rent increases included Richmond, Virginia (0.04%); Pittsburgh (0.1%); and Salt Lake City (0.37%). Among the remaining cities that saw market rent increases from February to March, the highest growth was in Sacramento, California (3.19%); Boston (1.06%); Hartford, Connecticut (0.97%); New York City (0.93%); and Cincinnati (0.88%).
Annual rent growth peaked at 17% in February 2022 (since Zillow began tracking in 2016) and has been slowly declining ever since. The annual growth rate for March is down 11 percentage points from that high. The city with the highest annual rent increase in March was Cincinnati, with an increase of 9.2% compared to March 2022. Las Vegas was the only city measured with a decline in rent — down 0.9% in March from the year prior.
Rent is one of the biggest contributors to how inflation is measured. Shelter, which includes rent, is the biggest portion (34%) of the consumer price index, or CPI, a proxy for inflation. In March, shelter accounted for more than 60% of the monthly increase in core inflation — excluding food and energy — according to the most recent CPI, released on April 12.
The shelter index increased 8.2% over the last year, according to the report. But current inflation doesn’t necessarily reflect current market conditions, because of the lag in how rent data is reported. That’s due to the cycle of renewals for leases, most of which last around a year.
Even with that lag, the rent-specific portion of the CPI has outpaced overall inflation for decades.
Methodology: Rent-to-income ratios by metro area
NerdWallet pulled the most recent available market rental data for 529 cities from the Zillow Observed Rent Index and matched it with the most recent available median household income data (2021) for cities by the U.S. Census Bureau. Certain cities identified in the Zillow Observed Rent Index weren't included in the U.S. Census Bureau list of median household incomes by city and thus weren't included in this analysis. A total of 225 cities were identified by both sets of data. Then, NerdWallet calculated the rent-to-income ratio using the following formula: Market rent/(median income/12 months).
(Photo by Joe Raedle / Getty Images News via Getty Images)