Labor Day Snapshot: 7 Stats About American Workers


Many or all of the products featured here are from our partners who compensate us. This influences which products we write about and where and how the product appears on a page. However, this does not influence our evaluations. Our opinions are our own. Here is a list of our partners and here's how we make money.
When Labor Day became a federal holiday in 1894 — well before artificial intelligence and remote work — the American workforce faced other significant disruptions.
Workers were beginning to leave the farming jobs that, up until the 1880s, had made up over half the workforce, according to a 1966 Wesleyan University study. Many of those farmers, as well as new immigrants, headed to growing cities for industrial work.
Then the industrial workforce changed, too. Manufacturing, as a percentage of the nonfarm workforce, peaked in 1953 at 32%, according to the U.S. Bureau of Labor Statistics (BLS). As of July 2023, that figure stands at 8%.
Since 1948, when the BLS began collecting employment figures, the nonfarming workforce has increased fivefold — and continues to evolve.
The last few pandemic-scrambled years have seen a huge spike in unemployment followed by an equally dramatic decline, as well as a work-from-home movement for office workers that may have changed some jobs for good.
Here’s a snapshot of the U.S. workforce on Labor Day 2023.
1. The lowest unemployment rate in five decades
The unemployment rate surged to a high of 14.7% in April 2020 at the start of the pandemic, but it didn’t stay there for long, BLS data shows. A year later, the unemployment rate fell to 6.1% and continued declining from there. By April 2023, unemployment hit 3.4% — a low not seen since May 1969.
Since March 2022, the unemployment rate has ranged from 3.4% to 3.7%. Its consistency reflects a resilient U.S. labor market despite economic woes, including high inflation and 11 federal funds rate hikes since March 2022.
2. Women are gaining on men in the labor market
During the peak of unemployment in April 2020, a higher percentage of women (16.2%) were out of work than men (13.5%), according to the BLS. But as the overall unemployment rate declined, women caught up. The July 2023 seasonally adjusted unemployment rate was 3.4% among women, compared with 3.6% among men.
3. Unemployment is low among all tracked races and ethnicities
Here’s what the unemployment rate has looked like since the BLS started tracking unemployment by race and ethnicity. Data for white workers begins in 1945; Black or African American workers in 1972; Hispanic workers in 1973; and Asian workers in 2000.
Black or African American
Highest: 21.2% (January 1983)
Lowest: 4.7% (April 2023)
Current rate: 5.8% (July 2023)
Hispanic
Highest: 18.8% (April 2020)
Lowest: 3.9% (September 2022)
Current rate: 4.4% (July 2023)
Asian
Highest: 14.8% (May 2020)
Lowest: 2.0% (May 2018)
Current rate: 2.5% (July 2023)
White
Highest: 14.1% (April 2020)
Lowest: 3.0% (May 1969 and February 2020)
Current rate: 3.1% (July 2023)
4. AI looks to be the new frontier in the workplace
Artificial intelligence is the latest disruptor to the workplace, accelerated by generative AI tools like ChatGPT from OpenAI, DALL-E and Bard. An estimated one-quarter of work tasks could be automated among the jobs most exposed to AI, according to a March report from Goldman Sachs, a global financial institution.
Another report released in July by McKinsey, a global consulting firm, estimates that by 2030, workplace activities that account for up to 30% of hours worked in the U.S. could be automated.
Meanwhile, employers are scrambling to incorporate AI into their work, in some case offering high-six-figure salaries to experts who can tell them how to do it.
5. Union membership is more rare than ever
About 14.3 million workers were part of a union in 2022, according to the BLS. But as a portion of the total U.S. workforce, union membership is more rare than ever. In 2022, just 10.1% of workers belonged to a union, down from 20.1% of workers in 1983, which is the earliest comparable data.
Despite this, labor unions are enjoying high public approval ratings. According to a Gallup poll conducted in August 2023, 67% of Americans approve of labor unions. That figure has been incrementally rising since a low point of 48% in 2009.
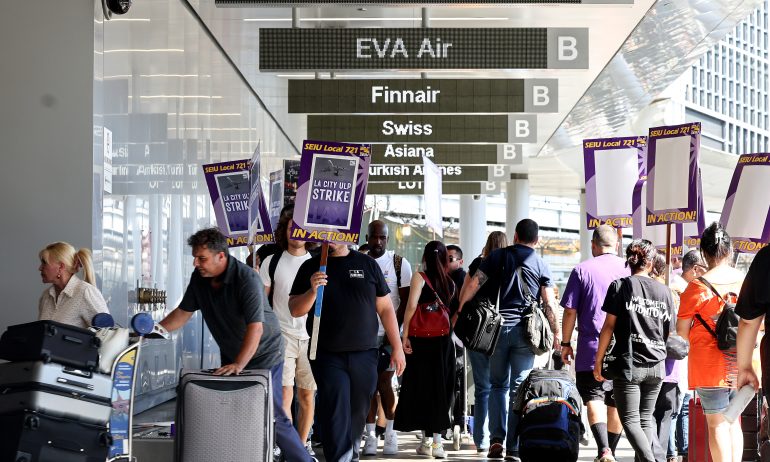
6. More workers are going on strike
Even while union membership is down, more workers are turning to strikes as a way to pressure employers to agree to higher wages and better working conditions. The number of workers participating in a major strike (involving at least 1,000 workers) increased by almost 50% from 2021 to 2022, according to the BLS.
In 2022, about 224,000 workers took part in a strike (of any size), according to data compiled by the Cornell University School of Industrial and Labor Relations Labor Action Tracker.
The current count is a blip compared to past decades. For some historical context: 1.7 million people participated in a work stoppage in 1979, BLS data shows.
7. Work-from-home arrangements are here to stay
The majority of full-time workers (59%) still spend their weeks on-site at their jobs, but the pandemic seems to have caused a permanent shift for many, with a larger share of workers now spending all or some of their time working from home. That’s according to the August 2023 Survey of Working Arrangements and Attitudes (SWAA).
Before the pandemic, workers spent less than 5% of their time working from home, according to the BLS’ American Time Use Survey. Now they do so more than 30% of the time, according to findings in the August SWAA.
The consortium of researchers and universities that has conducted the monthly online survey since May 2020 saw the figure pass 60% in fall 2021 at the height of the pandemic.
(Top photo by Mario Tama for Getty News via Getty Images)