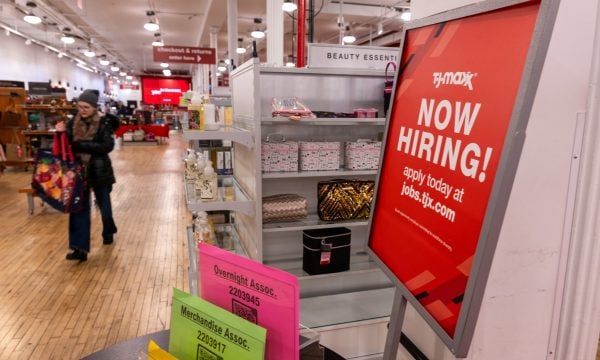





Updated on Oct. 15.
What’s ahead?
Here’s what NerdWallet’s news team is tracking in economic news and data for the week of Oct. 19:
Friday, Oct. 23: University of Michigan Survey of Consumers, final estimate for September
Why you should care: Consumer sentiment shows how people feel about the economy and can help predict how they’ll behave.
The U.S. economy is holding steady but facing some pressures. The economy is expanding again after a dip in Q1 2025, but growth so far in 2026 has been modest. The labor market is adding jobs, but not at previous levels, and inflation is below its peak but stubborn. The Federal Reserve looks at several economic indicators — along with the stock market — to form a better picture of the economy and make decisions on interest rates.
Meet MoneyNerd, your shortcut to smart money moves
NerdWallet's twice-weekly newsletter offers practical, no-fluff guidance to help you spend smarter, save more, and make confident money decisions. Delivered free to your inbox.
Is the U.S. in a recession?
The United States is not currently in a recession, but the impacts of new tariffs and a looming trade war have unsettled financial markets and raised fears of an economic downturn. Even President Donald Trump has said a recession is possible.
Is the U.S. economy growing?
Q1 2026: +2.1%
Q2 2026 GDP: +2.2%
The U.S. economy has shown steady growth since it dropped to unprecedented levels during the second quarter of 2020 due to the pandemic — and then rebounded almost as quickly. A year later, in the second quarter of 2021, the rate of annual growth hit a high not seen since the 1950s.
But in the first quarter of 2025, growth declined for the first time in nearly three years, primarily due to an increase in imports — a result of businesses stocking up on goods before tariffs began. The economy rebounded strongly in the second and third quarters, before slowing in the final quarter of 2025 and rebounding slightly in the first quarter of 2026.
Gross Domestic Product (GDP) is the market value — in current dollars — of all goods and services produced within the United States in a given period. The data that shows GDP adjusted for inflation is called Real GDP. All GDP changes are expressed on an annualized basis and reports are released quarterly by the Bureau of Economic Analysis.
Why it matters: GDP is a barometer for the health of the country. When it’s growing, that’s a good sign: consumers are spending, businesses are producing and jobs are being created. But when the GDP shrinks, or contracts, it signals that the economy may be slowing. If it contracts for two quarters, that can be considered a recession.
» Stay informed:
Check out NerdWallet's news hub for all the latest.
Subscribe to one of NerdWallet's free newsletters.
» MORE: GDP Report
What is the U.S. unemployment rate?
September unemployment rate: 4.2%
The U.S. unemployment rate is the share of unemployed people as a percentage of the overall labor force. Unemployed people are those who are actively seeking work. The labor force doesn’t include the entire population; it’s just the number of people who are employed plus those who are unemployed but looking for jobs.
The unemployment rate has topped 4% since May 2024.
Why it matters: Unemployment shows how the labor market is doing. When it’s low, people are finding work and feeling confident about job-hopping. When the rate is elevated, it shows the economy could be struggling, with fewer positions available for jobseekers.
How fast are wages growing?
June wage growth rate: 3.6%
Wage growth is moderating from what it was at this time in 2024 and is much lower than its peak in 2022. Still, the most recent data from the Federal Reserve Bank of Atlanta shows that annual growth is pacing much faster than it did in 2020.
Why it matters: Wage growth shows how workers are doing. If wages are rising, it means the job market is strong and employers are competing for workers. But when inflation rises faster than wages, then raises won’t stretch as far and consumers lose purchasing power.
Below is the three-month moving average of median hourly wages over the last decade.
Is inflation going down?
Inflation measures the rate of price increases, on an annual basis. The Federal Reserve is targeting a 2% inflation rate.
Why it matters: The Federal Reserve targets a 2% inflation rate. Inflation reports like the consumer price index (CPI) and personal consumption expenditure (PCE) index show how fast prices are rising. When inflation rates spike and wages don’t increase as strongly, it means it could be harder for households to stay afloat.
Consumer price index (CPI)
September CPI index: 3.7%
September core CPI index: 2.6%
The current inflation rate typically reflects the consumer price index (CPI), released monthly by the Bureau of Labor Statistics. The CPI measures changes in prices that consumers pay for goods and services including food, gas and rent. The core measure of the consumer price index excludes two volatile factors: food and energy.
Personal consumption expenditure (PCE) index
August PCE inflation rate: 3.4%
August core PCE rate: 3%
The Federal Reserve’s preferred measure of inflation is the core personal consumption expenditure (core PCE) index, which is released monthly by the Bureau of Economic Analysis. The PCE follows the goods and services consumers buy and the price they pay for them. It also tracks changes in spending habits as prices fluctuate.
» MORE: What is the PCE?
What’s going on with tariffs?
Since entering office, President Donald Trump has tried to enact sweeping tariffs affecting virtually all U.S. trade partners.
Those tariffs have been repeatedly struck down in court, including a Supreme Court ruling that ruled all of Trump’s so-called “reciprocal” tariffs illegal. The administration’s latest set of proposed tariffs could go into effect in July 2026.
We’ll continue tracking the latest tariff news here.
What’s happening with gas prices?
Commodity oil prices spiked after U.S. and Israeli strikes on Iran escalated into a broader war earlier this year. As a result, U.S. drivers have been seeing volatile gas prices. That price squeeze eased some in June, but is still present as shipping through the Strait of Hormuz begins to resume. Gas prices are still far higher than a year ago.
Why it matters: High gas prices mean consumers have less money available for other spending, which can slow the economy. Higher fuel prices also increase costs for businesses that rely on shipping, which can pass higher costs to consumers and fuel inflation.
» MORE: Gas prices in the U.S.
Here’s a snapshot of average U.S. gas prices right now.
How much is the U.S. dollar worth now?
The U.S. dollar is usually considered a safe haven, especially during times of market volatility and economic uncertainty, but the value of the dollar fell sharply in 2025, largely due to Trump’s protectionist policies and broad sweeping tariffs. It has been recovering in recent weeks.
Why it matters: The strength of the U.S. dollar shows its global demand. A strong dollar makes imported goods and services cheaper for U.S. consumers and businesses. It also eases inflationary pressure in the U.S. But a strong dollar could reduce demand for imports from U.S. businesses, which could slow growth.
What is the current U.S. trade deficit?
U.S. trade deficit in August 2026: $105.6 billion — up 13.7% from July 2026.
The U.S. has run a trade deficit for decades, but it has generally decreased since tariffs went into effect.
Source: U.S. Census Bureau and the Bureau of Economic Analysis (BEA).
» MORE: What is the U.S. trade deficit?
How much does the U.S. import and export?
Imports are goods that one country purchases from another country, while exports are goods that one country sells to another country. The latest U.S. Bureau of Economic Analysis (BEA) data shows:
Exports in August 2026: up 1.4% from July 2026.
Imports in August 2026: up 4.3% from July 2026.
Rent inflation
Rent costs are a significant factor driving inflation. That’s because rent is included within the shelter price index and shelter comprises the biggest segment of the CPI. The rent portion of the CPI has outpaced overall inflation for decades.
However, there’s a lag in how rent data is reflected in the CPI, which means rental shifts — up or down — won’t immediately be reflected in the report. The lag is due to the cycle of lease renewals. Companies that track rental prices, like the housing website Zillow, show that rent increases have slowed down for nearly a year, but that slowdown has yet to show up in the CPI report.
Why it matters: When rent rises faster than wage growth, it increases living costs, which means households have less money available for other expenses. High prices also shrink the affordable options available in the rental market.
» MORE: Rental market trends in the U.S.
When will interest rates go down?
Federal funds rate: 3.50 to 3.75%
The federal funds rate, also known as the Fed rate, is the interest rate that U.S. banks pay each other to borrow or loan money overnight.
The fed rate is set by the Federal Open Markets Committee (FOMC), which is the monetary policymaking arm of the nation’s central bank known as the Federal Reserve. At the FOMC’s eight scheduled meetings each year, it takes action on the federal funds rate. That means it will hike, hold or lower rates, depending on economic conditions.
After a year of paused interest rates, the Fed made rate cuts at its September, November and December 2024 meetings. The FOMC held rates steady at the majority of its 2025 meetings before making its first cut at its September meeting. A second rate cut followed at its October and December meetings. In 2026, there have been no rate changes.
Why it matters: The federal funds rate affects interest rates on consumer lending products like credit cards and mortgages. When the rate rises, borrowing becomes more expensive. That can lead to tighter lending standards, which means consumers and businesses tend to borrow less.
» MORE: What is the federal funds rate?
Consumer confidence in the economy
Consumer confidence — or sentiment — is an index that reflects people’s perceptions about the economy in the short-term and the outlook for the future. There are two main consumer sentiment indexes: the University of Michigan’s Index of Consumer Sentiment and The Conference Board’s Consumer Confidence Index.
Why it matters: Consumer sentiment shows how people feel about the economy and economists consider it a useful tool in predicting economic changes. How people feel about the economy can shape their behavior: If consumers are feeling optimistic, they’re more likely to spend money. But if their feelings are negative, they may pull back spending, which can slow economic growth.
Initial results for September from the University of Michigan, released on Oct. 9 show:
The Index of Consumer Sentiment registered at 46.3, down from 48.1 in September.
Current Economic Conditions registered at 44.7, down from 50.9 in September.
The Index of Consumer Expectations registered at 47.3, up from 46.3 in September.
The Conference Board’s Consumer Confidence Index
Conference Board data for September, released on Sept. 29, shows:
The Consumer Confidence Index fell 6.7 points to 81.9.
The Present Situation Index fell 7.9 points to 109.3.
The Expectations Index fell 5.9 points to 63.6.
How’s the stock market doing?
The health of the stock market is represented by major stock market indexes like the Dow Jones Industrial Average, S&P 500 or the NASDAQ 100. These indexes include broad sections of the stock market, but aren’t entirely exhaustive. That means the performance of these indexes represents the fluctuations in the entire market. So when the stock market goes up that means stock market indexes have gained value and vice versa.
Why it matters: The stock market reflects investor confidence in the economy. When stock prices rise, it means investors are feeling optimistic. When prices fall, it signals investors are uncertain or concerned about the economy. These stock fluctuations affect investments, retirement accounts, consumer confidence and business decisions.
» MORE: S&P 500 Index (SPX)
Data may be delayed and is for informational purposes only.
Latest mortgage interest rates
Mortgage rates change daily according to what’s happening in the economy.
NerdWallet’s daily mortgage rates below are calculated as an average of the annual percentage rate (APR) with the lowest points from a selection of major national mortgage lenders. The APR is based on the interest rate and indicates all of the costs of getting a loan including mortgage origination fees and discount points.
Why it matters: Mortgage rates affect housing affordability. When rates go up, so do monthly payments for buyers, which could make it harder to afford homes. For current homeowners, high rates may discourage them from selling, which can tighten the housing market and drive up home prices.
» MORE: Current mortgage interest rates
(Photo by Spencer Platt/Getty Images News via Getty Images)
Meet MoneyNerd, your shortcut to smart money moves
NerdWallet's twice-weekly newsletter offers practical, no-fluff guidance to help you spend smarter, save more, and make confident money decisions. Delivered free to your inbox.