2025 Household Credit Card Debt Study: 49% Say Card Debt is Normal
Revolving credit card debt continues to climb as nearly half of Americans say “it’s normal,” finds NerdWallet’s annual household debt survey and analysis.

Many or all of the products on this page are from partners who compensate us when you click to or take an action on their website, but this does not influence our evaluations or ratings. Our opinions are our own.
Published · 10 min read

Written by
Senior Writer & Content Strategist 
Edited by
Economist & Spokesperson You have reached the most recent version of this annual NerdWallet report. Previous years’ reports are available at the bottom of this page.
2025 was a year for the books, financially: The stock market reached new all-time highs, and the Federal Reserve cut rates three times; we went through the longest government shutdown in U.S. history and shouldered tariff-related price hikes. Through it all, Americans’ collective household debt has endured.
NerdWallet’s annual analysis of household debt finds that revolving credit card debt — or balances carried from month to month — has increased by more than 3% over the past year. Households with this type of debt owe $11,149, on average, as of December 2025.
Here’s a breakdown of what U.S. households owed in total and the average amount per household with each type of debt, as of December 2025, according to NerdWallet’s analysis:
| Type of debt | Average total owed by a U.S. household with this debt | Total owed in the U.S. | Percentage change for total owed between 2024 and 2025 |
|---|---|---|---|
| Any type of debt* | $178,102 | $18.78 trillion | +4.10% |
| Credit cards (revolving) | $11,149 | $676.29 billion | +3.25% |
| Mortgages | $233,580 | $13.17 trillion | +4.48% |
| Auto loans | $37,832 | $1.67 trillion | +0.73% |
| Student loans | $56,098 | $1.66 trillion | +3.03% |
| * This debt can include mortgages, home equity lines of credit, auto loans, credit cards, student loans and other household debt, according to the Federal Reserve Bank of New York. | |||
Revolving credit card debt has been on the rise since 2021, and the new year may mean more of the same. Nearly half of Americans who currently have revolving credit card debt (47%) say that debt is likely to increase in 2026, according to a new NerdWallet survey.
The survey of more than 2,000 U.S. adults, conducted online by The Harris Poll in November 2025, asked Americans about their credit card and buy now, pay later (BNPL) use. We also asked those who’ve ever had revolving credit card debt the steps they took to wipe their balances out, at least for a time.
Key findings
- Since 2020, median household income has slightly outpaced cost of living — income went up 27% during the five-year period, while costs have gone up around 25%, according to NerdWallet’s analysis. Transportation costs went up 35% and housing costs increased by 28% during this time frame.
- Over a quarter of Americans who currently have revolving credit card debt (26%) use buy now, pay later (BNPL) services regularly, according to the survey.
- The top two most cited debt payoff strategies for Americans who have ever had revolving credit card debt are spending less money (46%) and increasing income (35%), both of which could free up cash to put toward additional debt payments.
- About half of Americans (49%) say carrying revolving credit card debt is normal.
- Americans making only minimum required payments on the average amount of credit card debt would accrue nearly $18,500 in interest charges by the time the balance was paid off, according to NerdWallet’s analysis.
“Not everyone's income is keeping up with their cost of living, so many may go into debt not just for major purchases, but for everyday purchases, too,” says Sara Rathner, a NerdWallet credit cards expert. “It’s no wonder that so many Americans seem to view credit card debt payments as just another line item on their monthly budgets.”
Income growth (+27%) has slightly outpaced cost of living (+25%) since 2020
Each year, we look at how cost of living compares to income growth over the previous decade. Since 2015, median household income has gone up by about 53%, while the cost of living has only increased by 37%.
This pretty picture may leave some scratching their heads, because it certainly doesn’t feel like income is even keeping up with the cost of living, let alone surpassing it. When we zoom in closer and look at just the past five years — from 2020 to 2025 — we see how the COVID-19 pandemic and the following years of abnormally high inflation tell a less rosy story, but still show income growth that outweighs cost-of-living growth.
So what does this mean? Median household income is rising enough to cover overall cost increases, though it still lags behind housing and transportation cost growth, which is significant, since these are essential expenses for most Americans.
If your household feels financially squeezed, you’re not alone. In recent years, there’s been a divide between how the economic data looks and how it feels among consumers. Both of these are important metrics, particularly because consumers generally make spending decisions based on how they feel about their household’s stability, not what the economy at large is doing.
“It takes years to get over the discomfort of a high inflation period, and 2021 through 2022 was particularly painful as prices rose dramatically while income didn’t experience a similar acceleration. So as average income growth has caught back up, not all households are experiencing relief. Even if a household has seen income gains, higher debt may keep them from enjoying it.”
- Elizabeth Renter, NerdWallet’s senior economist
For Americans whose incomes aren’t keeping pace with their expenses, some may reach for a credit card to bridge the gap. And some may opt to break their purchases into multiple payments with buy now, pay later.
26% of Americans with credit card debt frequently use BNPL
Buy now, pay later services — like Klarna and Affirm — are common payment methods for many online shopping carts, and even sometimes when shopping in-store. They generally break your purchase into four payments; you pay 25% of your total at the point of sale, and then 25% every two weeks until the balance is paid off.
While this annual analysis of household debt doesn’t yet include BNPL balances per household, that doesn’t mean these amounts aren’t adding to consumer debt loads. According to our survey, 17% of Americans use BNPL regularly. That’s not inherently bad — used responsibly, this can be yet another tool in your financial arsenal to even out expenses throughout a month or two. However, it can become unwieldy for those who take on too many BNPL loans or who stack these loans on top of existing consumer debt.
More than a quarter of Americans who currently have revolving credit card debt (26%) say they use BNPL services regularly. And while the survey finds that some Americans (34%) don’t consider BNPL balances debt when not accruing interest or fees, these extra payments could certainly be taking away from money that might otherwise go toward knocking down credit card balances.
“When you have credit card debt payments and other bills each month, adding BNPL payments can be a stretch,” Rathner says. “Be mindful of this, because missing a BNPL payment can hurt your credit.”
Nearly half of Americans who’ve had revolving credit card debt spent less to pay it off
Getting out of credit card debt can be pretty simple, though not necessarily easy: Paying off debt generally requires either earning more money, spending less money or some combination of the two to free up cash for extra payments. The survey found that of Americans who have ever had revolving credit card debt, 46% spent less money and 35% increased their income in order to pay it off.
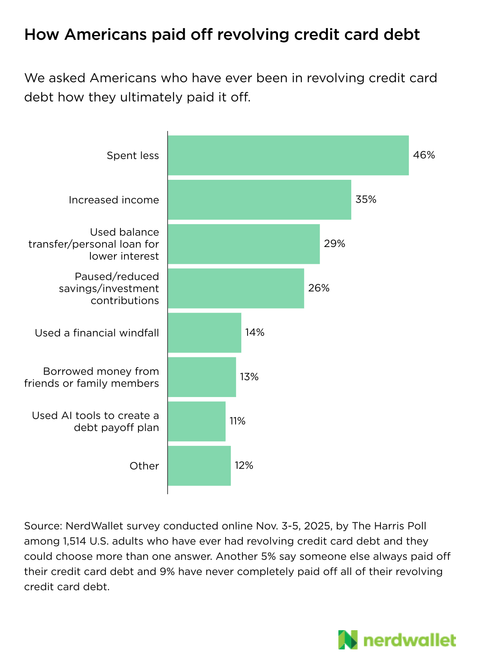
Some previous debtors received financial help — 14% of Americans who have ever had revolving credit card debt used a windfall (like a tax refund or inheritance) and 13% borrowed money from friends or family members in order to pay it off. But for most, getting out of debt required earning more or spending less, with some possible help from tools like AI and balance transfer offers.
What to do if you have credit card debt
Nearly half of Americans (49%) say carrying revolving credit card debt is normal. But try not to confuse normal with good when it comes to your finances. If you have credit card debt that’s costing you in interest and eating up your budget, it’s smart to put a plan in place to get it paid off, once and for all.
Break the cycle of credit card debt
Around 1 in 6 Americans (17%) have completely paid off all of their credit card debt in full and gotten back into it at least once. It can be a vicious cycle that spins into years of debt and interest accrual if not kept in check. Breaking the cycle may require a change in the way you spend.
Two in 5 Americans who currently have revolving credit card debt (40%) say they still regularly use credit cards. Unless you have no other way to pay for necessities — like food, gas and utilities — put away the credit cards and stick to cash or a debit card for the time being. Once your debt is paid off, you can reevaluate whether it makes sense for you to use a credit card again, only charging what you can pay off each month.
Nearly a third of Americans with revolving credit card debt (31%) say they opened a credit card with the intention of paying it off each month. This is a “know thyself” question: Can you realistically use credit cards without going into debt? If so, great! Credit cards can earn you rewards and provide consumer protections that debit cards just don’t. But if not, it’s likely the rewards — and even the purchase protection — aren’t worth the interest costs.
“Credit card debt is so hard to get out of. Unlike other loans where you borrow a set amount for a certain period of time, you can keep using your credit card and taking on more debt,” Rathner says. “It’s worth considering ways to limit how much you put on your card, by adjusting your budget and using a debit card or cash more often.”
Pay more than the minimum
More than a quarter of Americans with revolving credit card debt (26%) say they generally only make the minimum payment on their credit cards each month. For those with the average amount of revolving credit card debt, this could cost thousands of dollars and decades of time.
With a starting balance of about $11,400 and the average credit card interest rate of nearly 23% (as of August 2025), making just the minimum payments would result in nearly $18,500 in interest charges and a payoff date of nearly 22 years from now. And that’s assuming no additional purchases are made during that time period.
Even if you don’t get aggressive with debt payoff, adding what you can to your monthly payment could make a huge difference. By adding $50 to your minimum payment each month, you’d cut the interest almost in half and pay off the debt in less than 10 years. If you instead added $100 to your minimum payment, your interest would be around $7,000 and you’d be debt-free in just over 6 years.
Use the tools at your disposal to get out of debt
Only around a quarter of Americans with revolving credit card debt (26%) know when their balances will be entirely paid off. If it seems like your debt is so insurmountable that it’ll never be gone, calculating a debt-free date can show you there is a light at the end of the proverbial tunnel.
A debt payoff calculator can help you set this date and illustrate how adding extra payments can speed the process and save money in interest costs.
If you need a little more help, consider using AI tools, like ChatGPT or Gemini, to develop a debt payoff plan. More than 1 in 10 Americans who ever had revolving credit card debt (11%) used AI tools to create a debt payoff plan to completely pay off that debt, according to the survey. While AI won’t pay off your debt for you — at least not yet — it can help you examine your budget and provide advice on how to tackle your debt load most effectively.
“Credit card debt may be a part of your everyday life, but it doesn’t have to be a part of your life forever,” Rathner says. “There are tools and resources out there that can help you make a plan to pay down your debt.”
Cite as NerdWallet (2026). “2025 Household Credit Card Debt Study: 49% Say Card Debt is Normal.” Retrieved from https://www.nerdwallet.com/credit-cards/studies/household-debt-study
Methodology
The 2025 Household Debt survey was conducted online by The Harris Poll on behalf of NerdWallet from Nov. 3-5, 2025, among 2,094 U.S. adults ages 18 and older. The sampling precision of Harris online polls is measured by using a Bayesian credible interval. For this study, the sample data is accurate to within +/- 2.5 percentage points using a 95% confidence level. This credible interval will be wider among subsets of the surveyed population of interest. For complete survey methodology, including weighting variables and subgroup sample sizes, please contact [email protected].
NerdWallet’s analysis includes data from the following sources:
- Large Bank Consumer Credit Card Balances: Revolving Balances Only, July 2025, from the Federal Reserve Bank of St. Louis.
- Household Debt and Credit, December 2025, from the Federal Reserve Bank of New York’s Center for Microeconomic Data.
- Families and Households, December 2025, from the U.S. Census Bureau.
- 2022 Survey of Consumer Finances from the Board of Governors of the Federal Reserve System.
- Consumer Price Index, September 2025, from the U.S. Bureau of Labor Statistics.
- Historical Income Tables: Households, 2024, from the U.S. Census Bureau.
- Employment Cost Index Historical Dataset, September 2025, from the U.S. Bureau of Labor Statistics’ National Compensation Survey.
- Commercial Bank Interest Rate on Credit Card Plans, Accounts Assessed Interest, August 2025, from the Federal Reserve Bank of St. Louis.
To calculate household credit card debt, we divided the revolving credit card debt reported by the Federal Reserve Bank of St. Louis by the number of households with credit card debt. To calculate household debt for each debt category aside from credit card debt, we divided the average amount of each type of debt reported by the Federal Reserve Bank of New York by the number of households with that type of debt. We estimated this number of households by multiplying the total number of U.S. households by the percentage of households holding each debt type, based on data from the 2022 Survey of Consumer Finances.
To compare overall cost of living and CPI categories with income growth since 2015 and 2020, we escalated the 2024 median reported income from the U.S. Census Bureau to September 2025 using the Bureau of Labor Statistics’ Employment Cost Index for civilian workers.
Minimum payment calculations assumed a minimum payment of 3% of the balance or $35, whichever is higher on any given month.
Previous years' reports
Disclaimer
NerdWallet disclaims, expressly and impliedly, all warranties of any kind, including those of merchantability and fitness for a particular purpose or whether the article’s information is accurate, reliable or free of errors. Use or reliance on this information is at your own risk, and its completeness and accuracy are not guaranteed. The contents in this article should not be relied upon or associated with the future performance of NerdWallet or any of its affiliates or subsidiaries. Statements that are not historical facts are forward-looking statements that involve risks and uncertainties as indicated by words such as “believes,” “expects,” “estimates,” “may,” “will,” “should” or “anticipates” or similar expressions. These forward-looking statements may materially differ from NerdWallet’s presentation of information to analysts and its actual operational and financial results.
Article sources
NerdWallet writers are subject matter authorities who use primary,
trustworthy sources to inform their work, including peer-reviewed
studies, government websites, academic research and interviews with
industry experts. All content is fact-checked for accuracy, timeliness
and relevance. You can learn more about NerdWallet's high
standards for journalism by reading our
editorial guidelines.
Find the right credit card for you.
Whether you want to pay less interest or earn more rewards, the right card's out there. Just answer a few questions and we'll narrow the search for you.