Studies and Data Analysis
This data hub brings together NerdWallet’s studies and unique analyses of proprietary and third party data across personal finance and economic topics. Our team of writers, experts and analysts design nationally representative surveys and robust methodologies to gain insight into household finances. These resources are available for use by traditional and online media, influencers and consumers.
If you can't find the data you're looking for here, contact [email protected] for assistance.
In the spotlight
NerdWallet study: About Half of Insured Americans Financially Stressed by Premiums
A new NerdWallet survey shows that nearly half of Americans with auto insurance (49%) and Americans with homeowners insurance (46%) say they’re stressed about the costs of their premiums.
To alleviate the financial burden, some drivers and homeowners may consider lowering coverage amounts in return for lower monthly premiums. Around one-fifth of Americans with auto insurance (18%) say they have the minimum required coverage for their state and about 1 in 8 Americans with homeowners insurance (12%) have the minimum required coverage for their mortgage lender. Although this strategy may lower monthly expenses, being underinsured increases the risk of financial disaster from the types of extreme events insurance is designed to protect you from in the first place.
The latest
Recent economic commentary

Elizabeth Renter, Senior Economist
“Employers generally pull back on hiring well before they begin laying people off, but hiring has been in the tank for well over a year now. With the added impact of an energy shock and war, companies are facing even greater uncertainty as well as immediate tangible effects, like higher costs of living for workers and customers.”
March 31, 2026
Elizabeth Renter is available for media interviews, discussing economic and data topics. Contact [email protected].
Additional recent work from Elizabeth
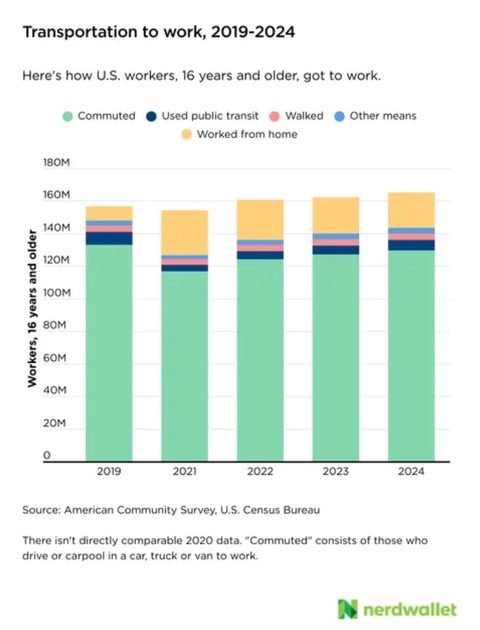
Trending chart
A recent NerdWallet analysis shows that between 2023 and 2024, the number of workers 16 and older rose by 2.9 million. Of these, 2.6 million are commuters. Work-from-home numbers dipped by around 420,000 year over year, the third year this group has shrunk.
Studies and data resources by topic
Credit cards
Money
Banking
Investing
Mortgages
Travel
Loans
Insurance
Small and medium-sized businesses
Our standards
All of our data projects go through a rigorous process before publication. During the planning stage, editors, data writers and analysts, subject matter experts and communications specialists share perspectives and ask tough questions of all potential ideas. We use data from only the most reputable sources, and our methodologies and calculations are all checked and rechecked for sound rationale and accuracy. Our data-driven work also goes through a minimum of three rounds of editing before publication.
Our nationally representative surveys are conducted in collaboration with The Harris Poll. We've been working with The Harris Poll since 2014 to field statistically sound and robust surveys weighted to be representative within age, gender, race/ethnicity, region, household income, education, employment, marital status and size of household where necessary to align with their actual proportions in the population.
Media inquiries
For questions, including requests for data or interviews with our analyst and experts, please contact [email protected].
Survey snippets
Disclaimer
NerdWallet disclaims, expressly and impliedly, all warranties of any kind, including those of merchantability and fitness for a particular purpose or whether the article’s information is accurate, reliable or free of errors. Use or reliance on this information is at your own risk, and its completeness and accuracy are not guaranteed. The contents in this article should not be relied upon or associated with the future performance of NerdWallet or any of its affiliates or subsidiaries. Statements that are not historical facts are forward-looking statements that involve risks and uncertainties as indicated by words such as “believes,” “expects,” “estimates,” “may,” “will,” “should” or “anticipates” or similar expressions. These forward-looking statements may materially differ from NerdWallet’s presentation of information to analysts and its actual operational and financial results.