Updated on July 14.
Tracking rent prices against inflation
The latest consumer price index report from the Bureau of Labor Statistics released on July 14, shows that in June the rent of shelter index (2.8%) and the shelter index (3.3%), which includes rent, continues to lag behind annual inflation (3.5%).
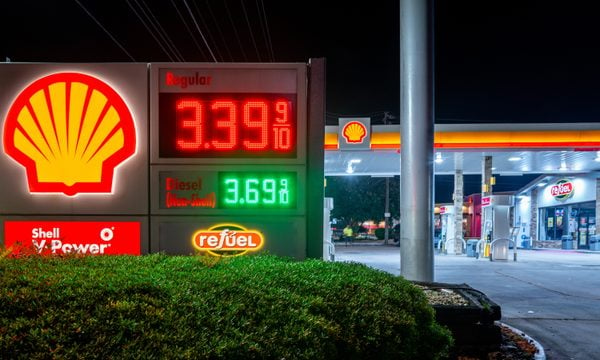
The disparity is due to the overwhelming spike in energy (+15.7%) — specifically the gasoline index (+26.7%) — which is pushing up overall inflation.
Over the 12-month period ending in June, rent alone was up 2.8%, according to the BLS. In May, the rent index was 3%.
It’s worth noting that rent increases in the CPI look different from data reported by rental websites like Zillow and Redfin because there’s a lag in how rent data is reflected in the CPI. That means it takes longer for rental shifts in the market to show up in the report.
The lag is primarily due to the cycle of renewals for leases. Since most leases last around a year, a renter’s costs will stay the same all year long. It’s only when the lease ends that a better understanding of the rental market emerges.
» Stay informed:
- Check out NerdWallet's news hub for all the latest.
- Subscribe to one of NerdWallet's free newsletters.
It’s worth noting that rent increases in the CPI look different from data reported by rental websites like Zillow because there’s a lag in how rent data is reflected in the CPI. That means it takes longer for rental shifts in the market to show up in the report.
The lag is primarily due to the cycle of renewals for leases. Since most leases last around a year, a renter’s costs will stay the same all year long. It’s only when the lease ends that a better understanding of the rental market emerges.
Meet MoneyNerd, your weekly news decoder
So much news. So little time. NerdWallet's new weekly newsletter makes sense of the headlines that affect your wallet.
Rents are more unaffordable than ever, here’s why
Over the past few years, it’s become more expensive than ever to rent — especially since the beginning of the pandemic. In fact, rents were unaffordable in 2023 for 22.6 million households that paid rent — an all-time high — according to a report on America’s Rental Housing by the Joint Center for Housing Studies of Harvard University released in December.
» MORE: Cost of living calculator
Spending 30% of your income on rent means a household is “moderately rent burdened,” but spending 50% or more means a household is “severely rent burdened” by federal standards. The Harvard study found that in 2023, half of all renters spent 30% or more of their income on rent and utilities, while more than a quarter of all renters spent 50% or more of their income on housing costs.
Why is rent so high?
Rent prices have spiked since 2020 because of a combination of factors, including inflation, low inventory, barriers to homeownership and shifts in tenant demand. Here’s how those factors have played out:
Inflation. Higher costs across the board mean landlords pass on higher costs (such as rising wages for maintenance workers or repair costs) to renters. Higher rent costs contribute to inflation and the cycle repeats.
Lack of inventory. There is a shortage of vacant rental properties in general, and of affordable ones in particular.
Barriers to homeownership. Prospective homeowners remain renters for longer as they face high demand and low inventory of existing homes, rising mortgage interest rates, as well as supply chain disruptions that have made it more expensive and difficult to construct new homes.
Expired rent freezes and discounts. Landlords made up for pandemic-era rent freezes and steep discounts in urban areas by hiking prices on new units and lease renewals.
A shifting workforce. As the pandemic increased the popularity of remote work, deep-pocketed renters sought larger homes in areas that had been previously relatively low-cost. This migration increased rents in suburban areas more than it lowered them in urban ones, yielding a net increase in rents.
More demand to live alone. Prospective renters are increasingly looking for studio and one-bedroom apartments, driving up demand for available housing.
Another thing to consider is that wages are rising slower than rents, which can make rent feel even more expensive. Since 2019, rent prices have risen at a rate 1.5 times that of wages, according to a May 7 analysis by Zillow.
When will rent prices go down?
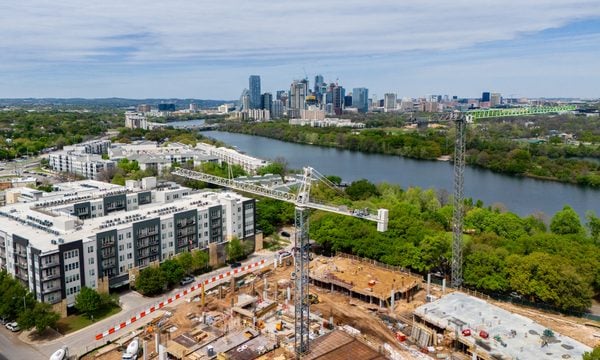
Prices have come down in some major U.S. cities, and that trend could become more widespread as apartment projects started in recent years become available to rent.
In 2024, developers completed construction on more than half a million new apartments nationwide, according to research firm Yardi Matrix — the second year in a row that the number of completed apartments hit a new record, according to an August 2024 report by the rental listing service RentCafe. The report also projected that developers would finish another 2 million units by 2028.
A new supply of housing is likely to slow overall rent growth or even reverse it. That’s been the story in cities like Austin, where a significant chunk of apartments finished in 2024 are located. And since many cities require inclusionary housing — meaning a portion of new housing must be affordable — new construction also means new affordable housing.
A rise in rent concessions, which could include short-term discounts like weeks or months of free rent or waived fees, is another indication that rent could be ready to come down. It means property owners may be feeling more negative about their ability to find renters.
Article sources
NerdWallet writers are subject matter authorities who use primary, trustworthy sources to inform their work, including peer-reviewed studies, government websites, academic research and interviews with industry experts. All content is fact-checked for accuracy, timeliness and relevance. You can learn more about NerdWallet's high standards for journalism by reading our editorial guidelines.
- 1.Joint Center for Housing Studies of Harvard University. Deteriorating Rental Affordability: An Update on America’s Rental Housing 2024.
- 2.RentCafe. New Apartment Construction to Reach Historic High of Half Million in 2024, Two Million Rentals to Open by 2028.