Inflation Slows in January
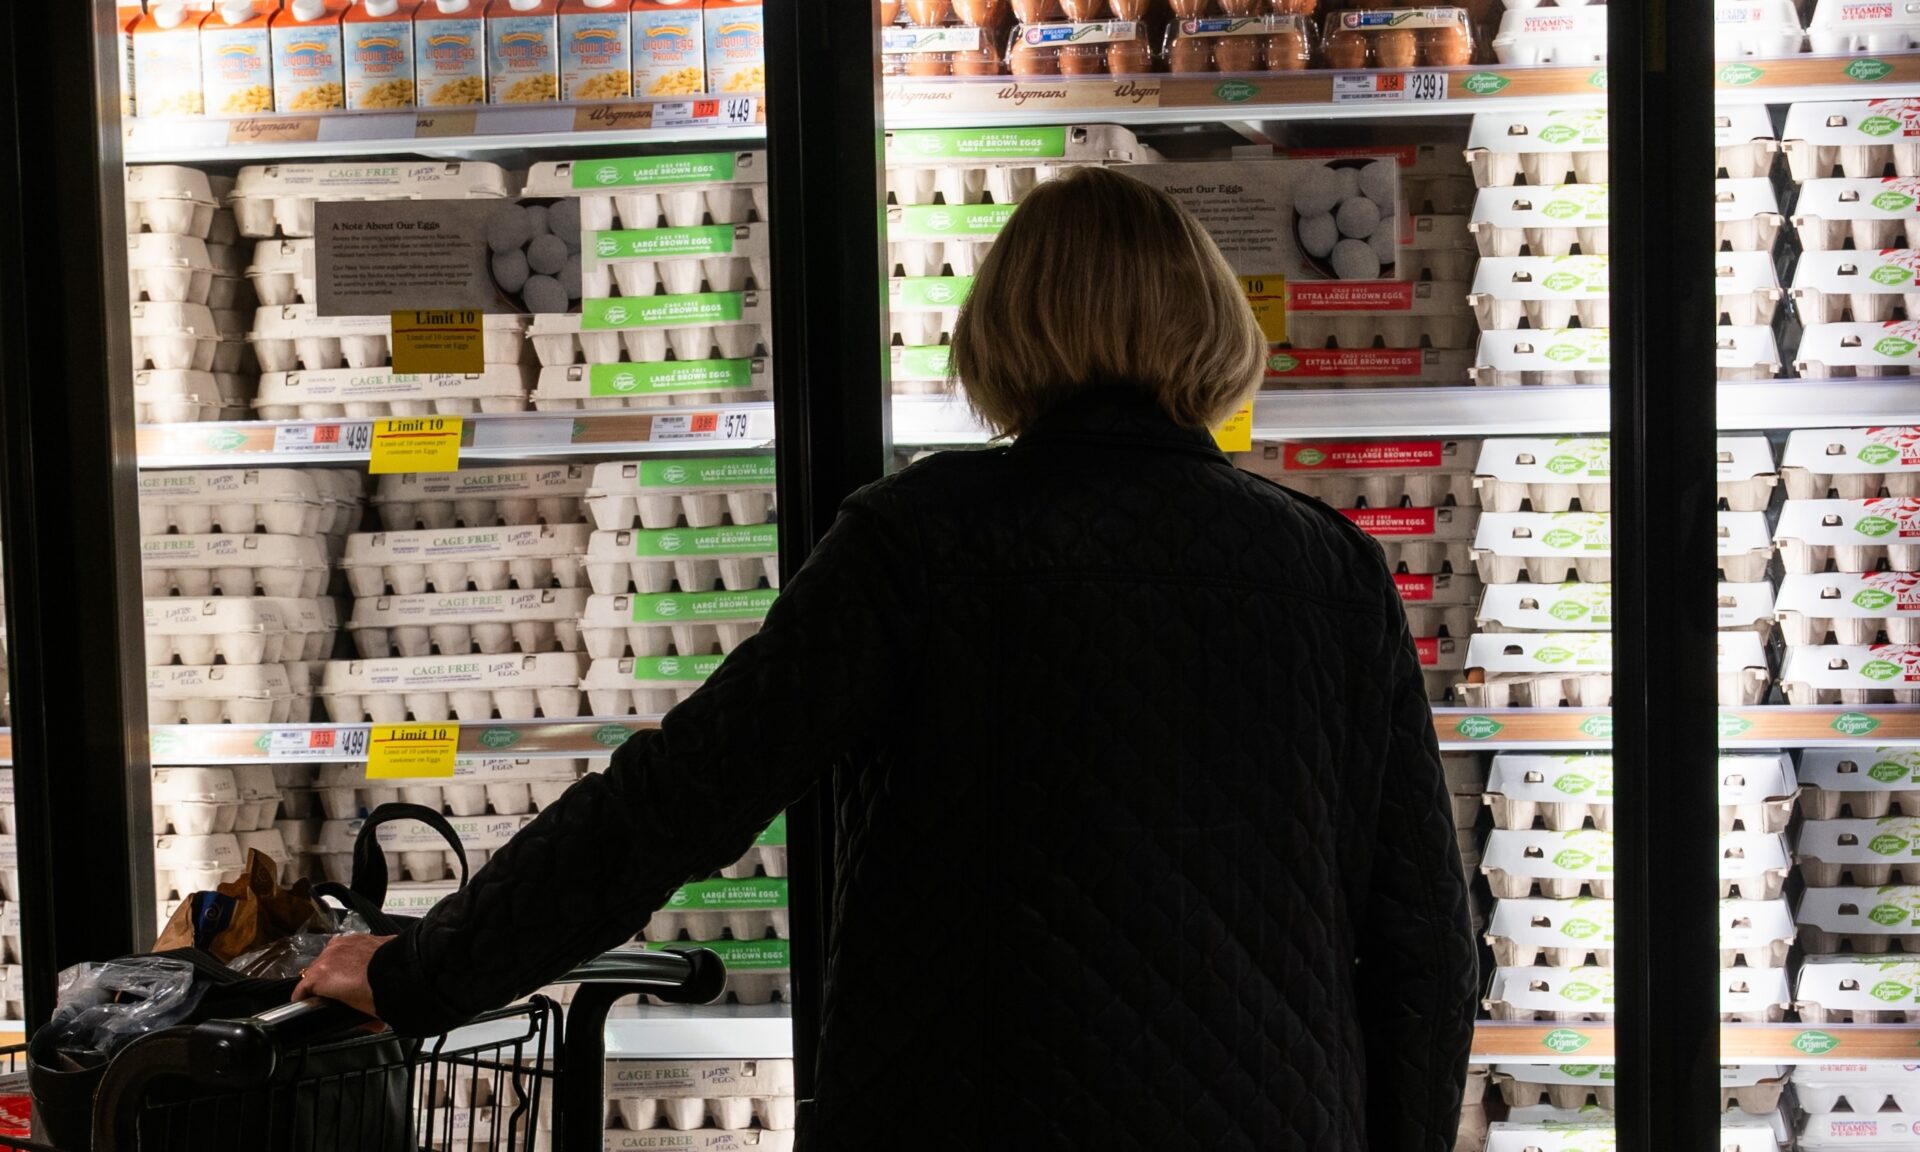
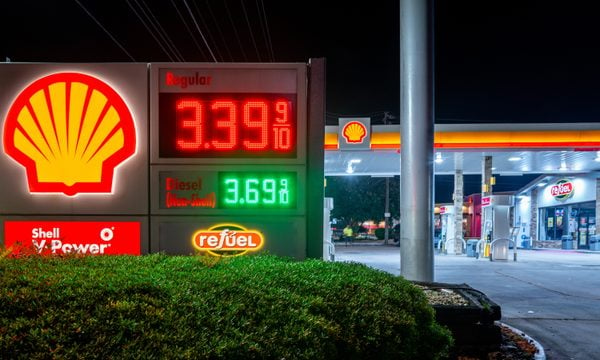
The latest CPI report shows gas prices were down while food prices rose.

Many, or all, of the products featured on this page are from our advertising partners who compensate us when you take certain actions on our website or click to take an action on their website. However, this does not influence our evaluations. Our opinions are our own. Here is a list of our partners and here's how we make money.
Updated on Feb. 13.
Current inflation readings
CPI for January
The consumer price index increased 0.2% in December, according to the most recent report. The year-over-year increase was 2.4% and the core CPI was up 2.5%.
Here’s what Elizabeth Renter, NerdWallet’s senior economist, had to say about the CPI report for January 2025, released by the Bureau of Labor Statistics on Feb. 13:
Economists and policymakers tend to look at core inflation to suss out what the true trajectory of price growth is. This measure removes the impact of food and energy, two volatile categories. But consumers tend to feel those two categories most, and both food and energy inflation headed in the direction of relief in January.
Food price growth slowed and gas prices actually came down. These are expenses that most Americans have every week. We interact with these prices on a very regular basis, so inflation here can be particularly painful. This pain can translate into worsened consumer economic sentiment, though we can’t expect a little relief here to translate into full consumer optimism — there’s much more at play in the bleak economic outlook held by U.S. consumers.
From a macroeconomic perspective, these inflation figures appear promising. But like the jobs numbers earlier this week, these figures don’t necessarily indicate all is well, at least not yet. If you put on your Fed hat, you know we need more data to know for certain if inflation will continue in the right direction, with no concurrent harm to the labor market. Risks to both sides of the dual mandate remain, but this week’s data from the Bureau of Labor Statistics points in the right direction.
PCE for October/November
Inflation remains stubbornly high, as indicated by the PCE price index for October and November, released simultaneously by the Bureau of Economic Analysis on Jan. 22 because of the interruption caused by the recent government shutdown. Prices rose at a 2.7% annual rate in October and a 2.8% annual rate in November. The month-over-month increase for both months was 0.2%.
- PCE price index: 2.8%.
- Core PCE price index: 2.8% — 0.8 percentage point higher than the Federal Reserve’s target rate.
PPI for December.
The PPI went up 0.5% in December, after a 0.2% increase in November and a 0.1% increase in October, according to the most recent data from the U.S. Bureau of Labor Statistics released on Jan. 30. On an annual basis, the index rose 3.0%.
Inflation is the rate that prices increase over time. Inflation explains why the same amount of money you paid for something in the past cost more today. It explains why something that cost you $100 in 2000 would cost about $187 in 2025.
» MORE: Run the numbers with NerdWallet’s inflation calculator.
There are three separate reports released monthly by individual government sources. Each index groups and tracks different buckets of goods and services to measure how much prices have changed. Each index is used as a proxy for inflation:
- Consumer price index (CPI)
- Personal Consumption Expenditure (PCE) price index
- Producer price index (PPI)
The CPI and the PPI are released each month by the U.S. Bureau of Labor Statistics (BLS), while the PCE is released by the Bureau of Economic Analysis (BEA). Typically, you’ll see the inflation rate reported for all items included in the reports. But it's also common to see it reported without energy or food price changes, because those categories tend to be more volatile. This version of the index is known as “core inflation.”
The CPI is the most commonly used inflation proxy so if someone says the inflation rate is 3% — the rate for September — they’re probably referring to the CPI.
However, the PCE — specifically the core PCE — is the preferred inflation measure used by the Federal Reserve Open Market Committee (FOMC) to make decisions on interest rates.
Meet MoneyNerd, your weekly news decoder
So much news. So little time. NerdWallet's new weekly newsletter makes sense of the headlines that affect your wallet.
Why inflation measures matter
The CPI, PCE and PPI are indicators of how the U.S. economy is doing. Monetary policymakers consider a low, stable inflation rate to be the mark of a healthy economy. The Federal Reserve targets a 2% annual inflation rate because it encourages businesses and consumers to continue spending, saving, borrowing and investing.
When prices rise sharply, it can mean that the economy is overheated, with too much demand for or too little supply of goods and services.
And of course, higher consumer prices — whether on everyday necessities like eggs or big ticket items like cars — put a strain on household budgets, especially if salaries aren’t keeping pace with inflation.
What is the CPI?
The consumer price index, or CPI, measures the change in average prices paid by consumers for a set of goods and services that represent regular expenses, like groceries or gas. The CPI is calculated by the U.S. Bureau of Labor Statistics and is used as a proxy for inflation. Every month, the BLS releases updated CPI data, showing monthly and annual changes in average prices.
January CPI report
The CPI increased 0.2% over the one-month period from December to January, after increasing 0.3% from November to December. Over the past 12 months, the CPI increased 2.4%, down from 2.7% in December.
Core CPI — a measure that excludes food and energy prices because of their volatility — rose 0.3% from December to January and 2.5% over the past 12 months.
Energy prices went down by 1.5% in January and 0.1% over the last 12 months. Gas fell by 7.5% over the last 12 months.
Food prices went up 0.2% in January. Food overall is up 2.9% over last year.
Shelter, which includes rent, increased at a rate of 0.2% in January and is up 3% since January 2025. See below for a look at the CPI’s key indexes.
The latest CPI report shows prices increased since December for airline fares, personal care, recreation, medical care, and communication.
Prices went down in other areas. Used cars and trucks, household furnishings and operations, and motor vehicle insurance were among the goods and services that got a little cheaper last month.
When is the next CPI report released?
The next CPI report will be released on March 11 and show data for February.
Who uses the CPI?
Private employers may use the CPI to determine how much to pay workers. The federal government also uses the index to reset eligibility levels for government assistance programs, federal tax brackets and cost-of-living increases. For example, the Social Security Administration (SSA) bases its annual adjustment on the CPI. For 2023, SSA announced an 8.7% cost-of-living increase — the biggest in 40 years — but in 2024, the increase dropped to 3.2%. For 2025, the SSA announced an even smaller increase of 2.5%. The increase for 2026 will be 2.8%.
Additionally, anyone can use the index to calculate buying power by adjusting historical values to see how they stack up in today’s dollars. For example, in 1972, median household income was $11,120, according to the U.S. Census Bureau. Factoring in inflation, that income had the same buying power as $85,102 in July 2024, according to the CPI inflation calculator on the BLS website.
How the CPI is calculated
To calculate the CPI, the bureau collects more than 80,000 prices per month from sellers and retailers in 75 urban areas. The price data captures the spending patterns of various populations.
The most commonly cited version of the index is the Consumer Price Index for All Urban Consumers (CPI-U), which shows the change in prices for the average household living in U.S. cities. The CPI-U represents more than 90% of U.S. consumers, making it the most broadly applicable.
The BLS groups goods and services into categories, such as food, shelter, energy and medical care services. Average prices for each item are aggregated and used to calculate the CPI with complex statistics. Everything included in the index is mathematically weighted so that each item or category’s effect on the index reflects its relative importance to consumers.
As an index, the CPI shows where current average prices for a particular basket of goods and services land on a scale relative to a historic reference point. But it’s more common to talk about the CPI’s inflation rate, which illustrates how much prices have increased between two points in time (or decreased, in the event of deflation).
That rate is calculated by determining the current index value of the basket of goods and services, then dividing it by the value of those same goods and services from a year or month prior. The result is then multiplied by 100.
What is the PCE?
The personal consumption expenditures price index, or PCE, measures changes in consumer spending on typical goods and services. It’s used to calculate inflation (or deflation) in the U.S. economy.
Updated each month by the Bureau of Economic Analysis (BEA), the PCE tracks what kinds of goods and services consumers buy and how much they pay for them, as well as how consumers change their spending habits when prices rise or fall.
For example, if rising gas prices lead consumers to drive less and cut down on fuel spending, the PCE will reflect that change in purchase frequency.
What’s the core PCE and why does it matter so much?
Core PCE is the Federal Reserve's preferred measure of inflation. Core PCE excludes food and fuel — two categories that frequently experience price swings. Increases in both PCE and core PCE can signal an increase in inflation; decreases may signal a decline in inflation. These results could also indicate that inflation is still growing, but at a cooler pace.
The Fed’s target for inflation is 2% on an annual basis.
- PCE is at 2.8% (up from 2.7% in October).
- Core PCE rose 2.8% over the past year.
What did people spend money on in November?
Current-dollar PCE — the total consumers spent on goods without inflation adjustments — went up by $108.7 billion in November. That amount reflects spending increases in both goods and services.
Personal income and savings increased in November:
- Personal income increased by 0.3% in November. It was largely driven by increases in compensation and government social benefits.
- Disposable income (after-tax) increased by 0.1% in November.
- Personal savings rate — the amount people save from their disposable income — was down slightly from October at 3.5%.
How is PCE calculated?
The BEA calculates the PCE index using data from businesses and trade organizations, and the gross domestic product. The GDP measures the total dollar value of goods and services produced in the U.S. in a given quarter.
Much of the data from businesses and producers come from the U.S. Census Bureau. Specifically, the BEA uses the Census Bureau’s annual retail trade surveys, economic censuses, quarterly services reports and monthly retail trade surveys. It also uses reports from private trade organizations and regulatory agencies. Through these reports, the BEA can estimate what goods and services were sold in a given time period.
Next, the BEA divides consumer goods into three buckets:
- Durable goods, or goods that will be used for at least three years. This includes items like furniture and motor vehicles.
- Non-durable goods, or goods that have a shelf life of less than three years. Food, beverages, clothing and gasoline fall into this category.
- Services, such as health care, housing, utilities and insurance.
Then, the BEA takes all that consumption data and calculates how much consumers spent on those goods. It factors in things like retailer markups and taxes, too.
When is the next PCE report released?
The PCE is released monthly in the BEA’s Personal Income and Outlays report. The next release, covering December, is scheduled for Feb. 20.
What is the PPI?
The PPI tracks the prices that producers and manufacturers receive for their goods from retailers and distributors. The PPI rises when producers and manufacturers charge higher prices for their products, likely to offset the rising costs of raw material or distribution.
In this way, PPI functions as another measure of inflation, similar to the consumer price index and personal consumption expenditures price index, which track the prices consumers pay for goods and services. But unlike those two indexes, the PPI shows how prices are changing for retailers who are buying at the wholesale level.
“In general, the PPI is about the price change from the perspective of the seller,” says Thomas McDonald, a senior economist at the BLS. That makes the PPI a leading indicator of inflation since higher prices on the producers’ end often lead to increased prices for consumers.
PPI categories
In calculating the PPI, the BLS sorts products and services into two categories: final demand and intermediate demand.
Final demand refers to goods and services sold by the producer to retailers or distributors, who intend to sell those products to consumers.
Examples of a final demand good include, well, pretty much any physical product you could buy: clothes, computers, furniture, cosmetics — you get the picture. Examples of final demand services include air travel, internet, home security, cleaning services and financial advisement, according to the BLS.
Intermediate demand refers to goods and services sold to other manufacturers to be used in the production of other goods.
Here’s an example McDonald provides to explain how businesses use the PPI. Say you have a contract to pave and repave roads with Fictional County. In your contract, you’d likely include a clause that allows you to raise your price if, say, the PPI’s asphalt index rises (in other words, if asphalt becomes more expensive).
December PPI report
The index rose 0.5% in December. Compared to a year ago, the index increased 3.0%.
Here are highlights from the latest PPI report:
- Core PPI, which excludes food, energy and trade services, increased by 0.4% in December compared to 0.2% in November. It rose 3.5% compared to a year ago.
- Final demand goods prices were unchanged in December after rising 0.8% in November, which was the largest rise since Feb. 2024.
- Final demand services prices rose 0.7% in December — the largest increase since July.
How is the PPI calculated?
Once a month, the BLS solicits roughly 100,000 prices for specific products or groups of products from participating sellers. Then, those prices are weighted against their price in a “base” year, which for many products is 1982.
In addition to classifying products based on final demand or intermediate demand, the BLS sorts products and services by industry. It also categorizes them by commodity classification, which is solely based on their material composition.
When is the next PPI report released?
The BLS releases a monthly PPI report showing how the index changed. The PPI report for January will be released on Feb. 27.
(Photo by Spencer Platt/Getty Images)
Article sources
NerdWallet writers are subject matter authorities who use primary,
trustworthy sources to inform their work, including peer-reviewed
studies, government websites, academic research and interviews with
industry experts. All content is fact-checked for accuracy, timeliness
and relevance. You can learn more about NerdWallet's high
standards for journalism by reading our
editorial guidelines.
Related articles


