Nerdy takeaways
- It isn't easy to beat the market with individual stocks — but good stock analysis techniques can help.
- Fundamental analysis of stocks focuses on the company, and seeks to determine the fair price of its stock.
- Technical analysis focuses on patterns in the price of the stock itself, like support, resistance and ranges.
- Stock analysis is a lot of work — and a passive portfolio of index funds can be a practical alternative.
For the average retail investor, trying to beat the market by analyzing and investing in individual stocks isn’t an easy feat.
According to Keith Lichtman, the Managing Director of Concert Financial Planning in Atlanta, it’s fine for investors to educate themselves on the basics of stock analysis, but most aspiring stock traders fail to realize how unlikely it is to see sustained success.
“Over a long-term time horizon, say five, 10, 15, 20 years and beyond,” Lichtman says, “it’s extremely hard to pick winning securities.”
But if you’ve got the itch to learn more about stock analysis, it’s best to go about it responsibly. And while Lichtman doesn’t recommend it to his clients, he says investors who have already funded a long-term investment plan built on highly diversified low-cost index funds could consider a “casino fund” that comprises no more than 5% of their entire portfolio. It’s here where they could potentially try their hand at vetting individual securities and investing in them.
So if that’s you, here’s how to make sense of stock market analysis.
Brokerage firms | |
|---|---|


Types of stock analysis
There are two main types of stock analysis: fundamental and technical.
Fundamental analysis of stocks
Fundamental analysis of stocks focuses on the company itself and seeks to determine the true, fair value of a company’s stock price, based on recent earnings, past earnings growth rates, projected earnings, multiples like PE ratio, debts and other financial and accounting measures.
By studying these metrics, fundamental analysts create forecasts for where they think the stock price could go based on the performance of the company. This article will focus on technical analysis, but you can also explore NerdWallet’s guide to fundamental analysis.
Technical analysis of stocks
Technical analysis focuses on the behavior of the stock price itself. A technical analyst may identify patterns in a stock price’s historical movements, look for repeats of these patterns and make investment decisions based on whether these patterns emerge. Often, traders will use a combination of the two studies to make their investment decisions.
Support and resistance
Technical analysis is a funny thing. It’s based on mechanical patterns, but those patterns wouldn’t exist without human emotion. And understanding support and resistance is all about learning to read investors’ emotions.
Support
Support shows a price that traders think might be a good place to buy in, because they don’t see it as likely that the stock price will fall much lower in a given period. Imagine a stock whose price fluctuates between $80 and $120 over the course of a few months. If there’s a pattern of the stock price dipping to around $80 then going back up, you could say there’s a line of support at $80. Trading software will draw an actual line connecting the lows to help you see that trend.
Similarly, if the stock price dipped to $80 one week, but then only to $90 another week and just $100 the next week, you could draw an upward diagonal line of support connecting those rising lows. A trader may use this trend to extend the line of support into the future to make a guess at what the next low might be, and decide to buy in then.
» Get started: See the best online platforms for day trading
Resistance
If support is used to predict lows, resistance is used to predict highs. Using the same example, if there’s a pattern of that stock hitting $120 multiple times and then falling, you could say there’s a line of resistance at $120, which could signal to traders that $120 may be a time to sell.
If instead, that high goes from $120 to $110, and then to $100, you could connect these highs with a downward trend line. A trader may see this as an opportunity to sell as high as possible before the stock falls any lower, or avoid the stock entirely.
Below are two graphs that help explain support and resistance at various intervals. The graph on the left shows weekly prices of Apple’s stock over the course of years, indicating two diagonal lines of support (green) and one upward diagonal line of resistance (red).
The graph on the right shows daily prices of a few months, and identifies a horizontal line of support and a downward diagonal line of resistance.
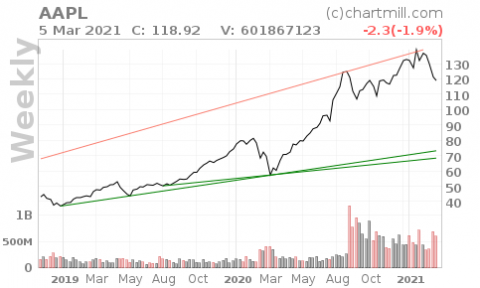
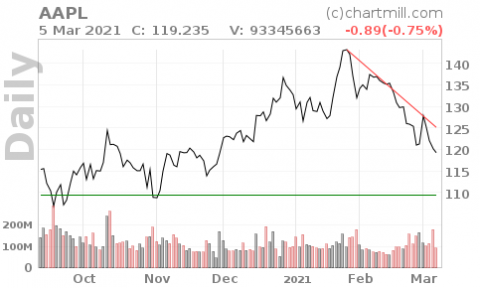
(Charts courtesy of Chartmill)
Keep in mind that drawing these lines accurately requires additional analysis, such as finding moving averages, or applying multiple lines to the graph to find a common thread. It’s not unlike tracking a hurricane — you run multiple scenarios to find the most likely path. And, just like storm tracking, forecasts can be wildly inaccurate for many reasons.
Reading candlestick charts
Candlestick charts are a convenient way for investors to see the open, close, high and low prices of a particular period. And that period varies: If it’s for one trading day, you’ll see those measures for each day, side by side, over the course of weeks or months. If the period is one minute, you’ll see the open, close, high and low of each minute over the course of a shorter time frame, such as one hour.
The basic parts of the candlestick are the body (formally called the “real body”) and the wick (known as the “shadow”). Here’s how it works:
- If the price rises after the open, the body will rise (often colored green). If the price falls, the body will fall (often colored red).
- The end of the wick marks the highest or lowest price for that period. If the body hits a high but falls back lower, the wick shows the difference between that high and the current price. Similarly, if the body falls to a low but then rises again, the wick shows the difference between that low and the current price.
- If there’s no wick, that means the price ended the period at either the high or the low, depending on which wick is missing.
Below is a six-month chart of Apple’s stock shown in candlesticks, with each candle representing one trading day.
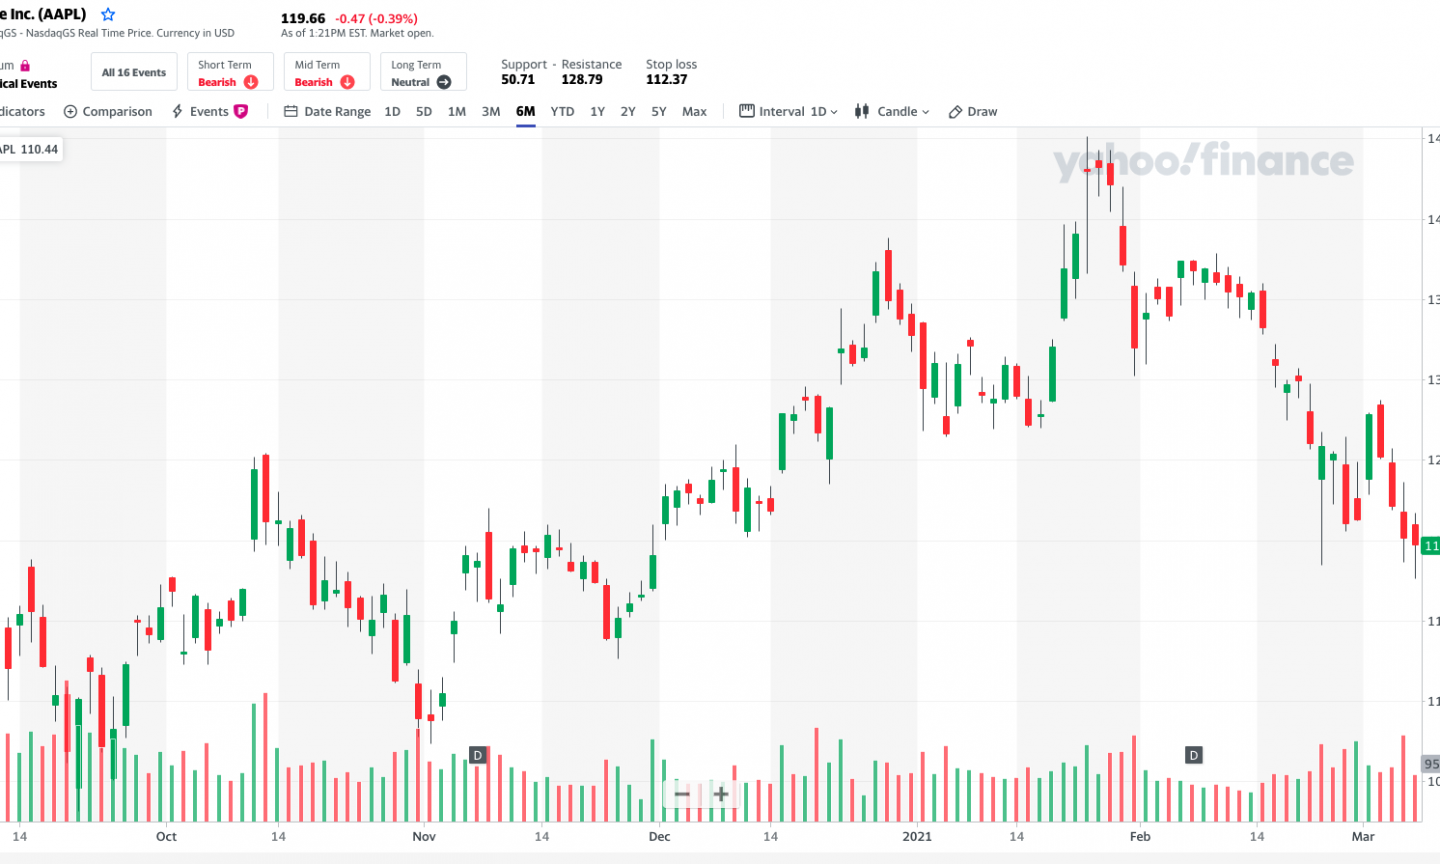
(Chart courtesy of Yahoo Finance)
By studying the changes in the shape of the candle from period to period, certain patterns may develop that could indicate the direction of the price in the short term.
» Dive deeper: Learn how to read stock charts
Price range
To get context around the price of a stock, you can look at its 52-week range, which shows the highest and lowest prices of the last 52 weeks. Looking at a stock’s current price compared with its 52-week high or low can help investors understand the gravity of the day’s price changes, says Kenny Polcari, managing partner of Kace Capital Advisors and market analyst for CNBC and Fox Business Network.
For example, let’s say the 52-week high is $128 and the stock closed the day at $125. Even though it closed down, it’s still much closer to the 52-week high than the low.
“That would give you a sense that the stock is strong, and it remains strong, even though it’s down $3 today,” Polcari says.
Volume vs. average volume
Volume shows investors the number of trades that have taken place that day. Generally, it’s a way to gauge liquidity (how quickly the stock can be traded without an outsized effect on the stock’s price), but other narratives may be found in the numbers. If there’s a huge difference between daily volume and average volume, there may be something going on with the stock worth exploring, Polcari says.
You can see how volume and price are related by looking at the green and red bars at the bottom of a stock chart. The higher the bar, the higher the volume. Green bars indicate the buyers were being more aggressive, while red bars indicate sellers put the stock price under pressure.
“If you look at the chart and all of a sudden you see green, green, green and no red, that would suggest the stock is absolutely under accumulation, which means the majority of orders are buy orders. People are being aggressive, and they want in on this stock,” Polcari says. “It’s mostly going to be representative of institutional volume. It’s not going to be representative of retail volume. But that’s still a good sign.”
Conversely, Polcari concluded, seeing all red is a sign there’s distribution, meaning that people — institutions again, typically — are getting out of the stock and pushing the price lower.


Is stock picking right for you?
This is just the beginning of a deep, deep technical stock analysis rabbit hole. And while you may be tempted to put on your headlamp and explore it further, just keep Lichtman’s warnings in mind: Engaging in short-term stock picking and day trading means going up against institutions that spend millions of dollars on resources and technology to get an advantage over other institutions spending millions of dollars on resources and technology. And you’re the retail investor caught in the middle of it with a smartphone and a free trading app.
“It’s almost like bringing a knife to a gunfight,” Lichtman says.
If you’d rather not show up to a fight at all, a good rule of thumb is to consider long-term index funds, and call it a day.
Neither the author nor editor held positions in the aforementioned investments at the time of publication.