Studies and Data Analysis
This data hub brings together NerdWallet’s studies and unique analyses of proprietary and third party data across personal finance and economic topics. Our team of writers, experts and analysts design nationally representative surveys and robust methodologies to gain insight into household finances. These resources are available for use by traditional and online media, influencers and consumers.
If you can't find the data you're looking for here, contact [email protected] for assistance.
In the spotlight
First-Time Home Buyer Affordability Data — Q3 2025
A recent analysis from NerdWallet Senior Economist Elizabeth Renter showed that the number of active listings continued rising in the third quarter of 2025 while list prices dipped a bit. Put together, these trends — more options and stable prices — are positive news for home buyers.
Specific findings included:
List prices fell 2% in the third quarter to $432,600, on average, nationwide.
National inventory rose 7% quarter over quarter, and is up 21% compared to the same period last year.
National real estate statistics give the broadest perspective of the real estate market, but for home buyers the only market that matters is the one they’re buying into. For them, quarterly trends and national averages don’t answer their fundamental question: What’s the monthly cost to buy a home?
That answer depends largely on where you’re buying. With a 10% down payment, buyers in Pittsburgh, Cleveland and Detroit could have a sub-$2,500 monthly payment for an average-priced home while buyers in San Francisco, Los Angeles and San Jose could have payments above $7,000.
The latest
Recent economic commentary

Elizabeth Renter, Senior Economist
“The recurring dissent and particularly the fact that people are disagreeing in both directions — some wishing to hold rates as-is and others to cut more — is evidence of the difficult economic period we’re in.”
Dec. 10, 2025
Elizabeth Renter is available for media interviews, discussing economic and data topics. Contact [email protected].
Additional recent work from Elizabeth
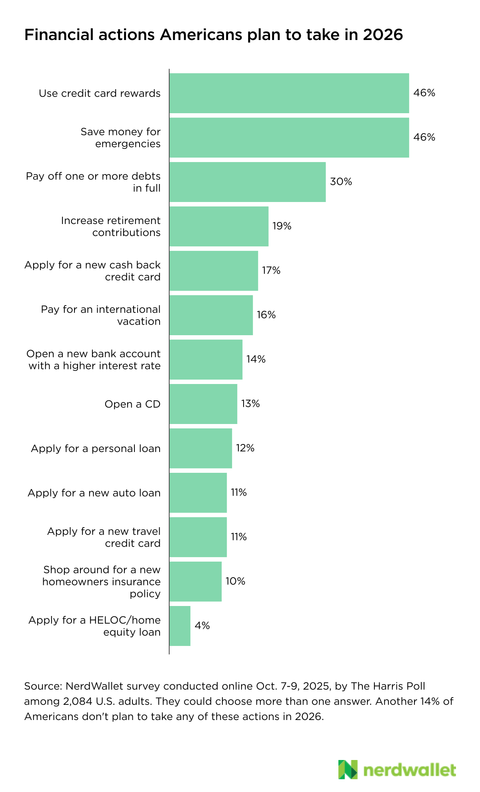
Trending chart
NerdWallet’s Consumer Outlook Report revealed the financial plans consumers are making for 2026.
Studies and data resources by topic
Credit cards
Money
Banking
Investing
Mortgages
Travel
Loans
Insurance
Small and medium-sized businesses
Our standards
All of our data projects go through a rigorous process before publication. During the planning stage, editors, data writers and analysts, subject matter experts and communications specialists share perspectives and ask tough questions of all potential ideas. We use data from only the most reputable sources, and our methodologies and calculations are all checked and rechecked for sound rationale and accuracy. Our data-driven work also goes through a minimum of three rounds of editing before publication.
Our nationally representative surveys are conducted in collaboration with The Harris Poll. We've been working with The Harris Poll since 2014 to field statistically sound and robust surveys weighted to be representative within age, gender, race/ethnicity, region, household income, education, employment, marital status and size of household where necessary to align with their actual proportions in the population.
Media inquiries
For questions, including requests for data or interviews with our analyst and experts, please contact [email protected].
Survey snippets
Disclaimer
NerdWallet disclaims, expressly and impliedly, all warranties of any kind, including those of merchantability and fitness for a particular purpose or whether the article’s information is accurate, reliable or free of errors. Use or reliance on this information is at your own risk, and its completeness and accuracy are not guaranteed. The contents in this article should not be relied upon or associated with the future performance of NerdWallet or any of its affiliates or subsidiaries. Statements that are not historical facts are forward-looking statements that involve risks and uncertainties as indicated by words such as “believes,” “expects,” “estimates,” “may,” “will,” “should” or “anticipates” or similar expressions. These forward-looking statements may materially differ from NerdWallet’s presentation of information to analysts and its actual operational and financial results.